Personalize search and product view
The search view provides an overview of the search terms received and their most important KPIs over a chosen period of time.
.png)
The search terms are grouped by channel and can be sorted by KPIs. To sort, simply left-click on the column header. The entire channel is at the top of the search terms as a comparative value.
The KPIs are divided into several groups, of which individual values can be folded. These are then unfolded again by clicking on the group name.
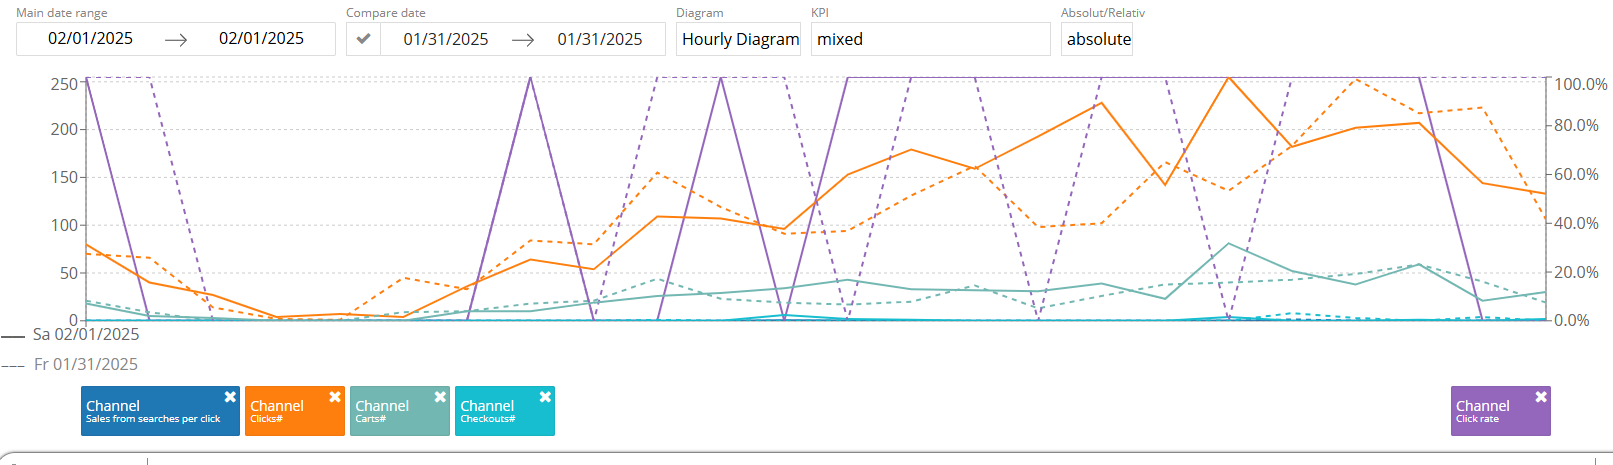
You can visualize your data with different diagram types.
Hourly diagram
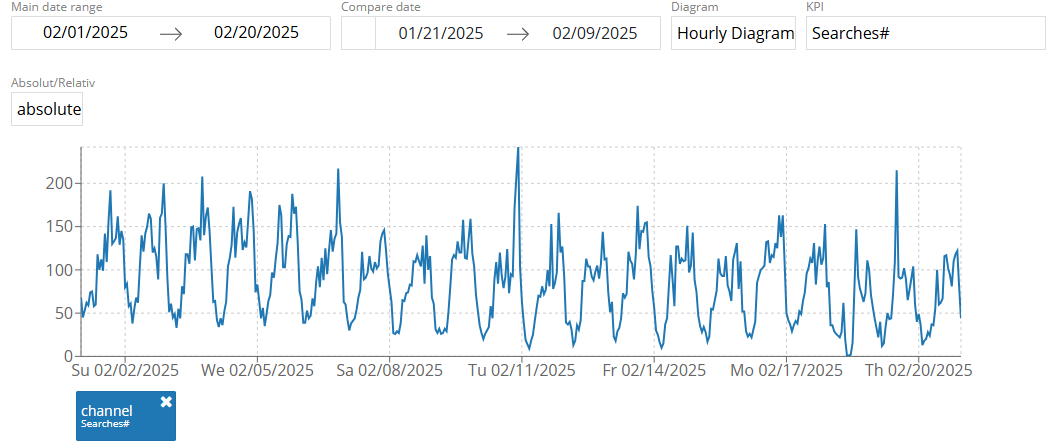
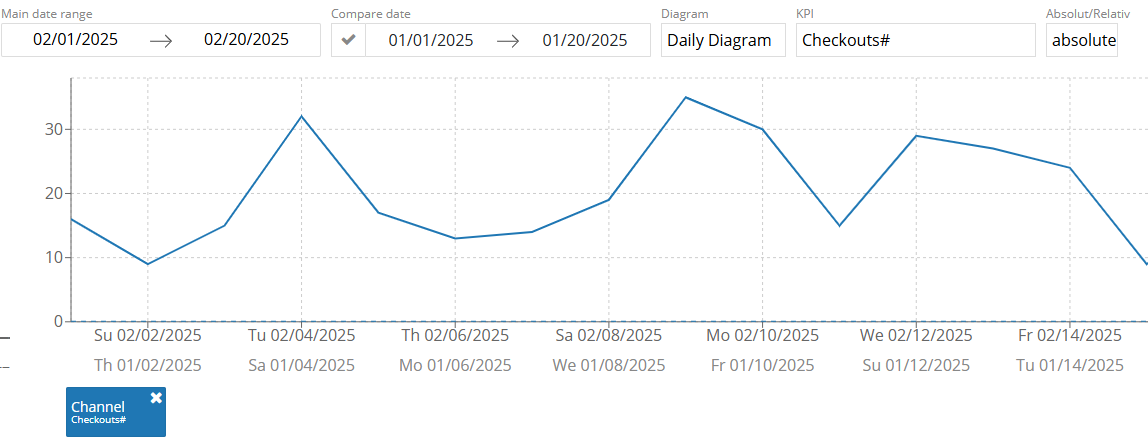
The data can be either visualized as an hourly diagram (above). As a daily diagram (below).
Daily diagram
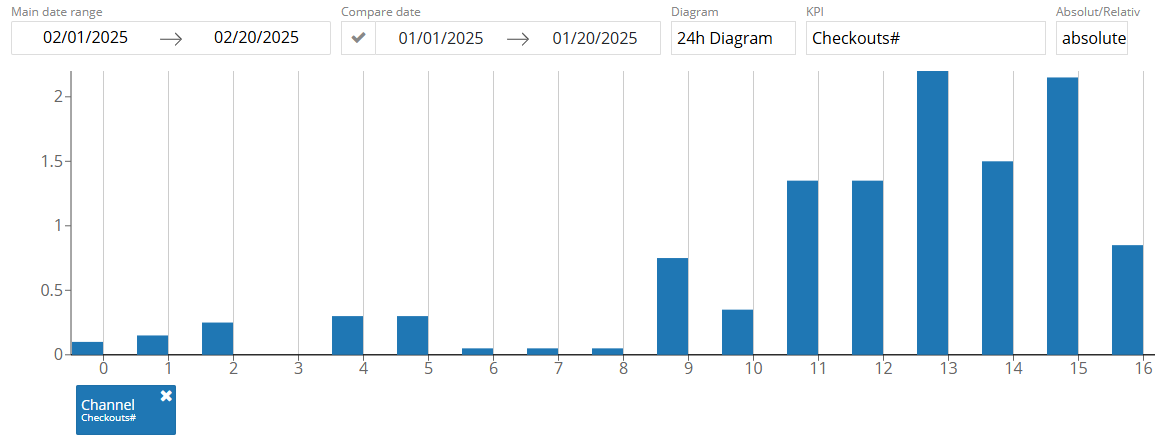
24h diagram
You can choose the 24h diagram for a block view.
The KPI drop-down allows you to set all search terms displayed in the diagram to one KPI (e.g. searches or clicks).
The last option allows you to switch from an absolute view to a relative one. This is useful, for example, to measure individual search terms against the daily trend.
How to apply filters?
In the default setting all products or search terms are listed. However, it is also possible to filter this view.
You can apply these filters by clicking on the funnel symbol below the KPI’s name:
.png)
Here you can define one or more filter conditions, e.g. only show articles that have generated searches of a high volume.
Click on the ![]() button to apply the filter.
button to apply the filter.
Compare values?
You can compare all possible metrics in the diagram. Just click and hold the desired value and drag it to one of the color fields in the diagram.
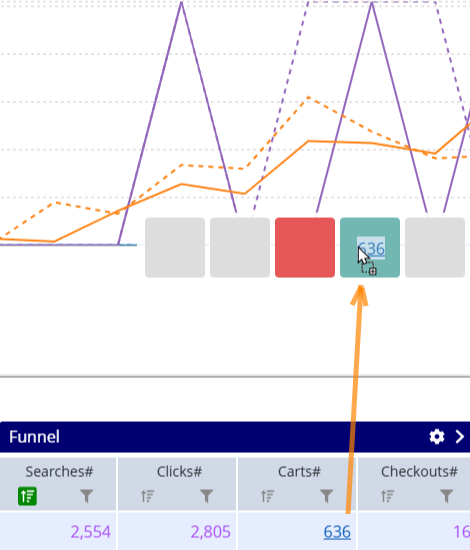
You can also compare several values of a search term, e.g. click and add-to-cart rate.