The smart algorithms
What would analytics be without clever algorithms that work in the background and tell you as a user in advance which search terms you should take a closer look at? We use two different machine learning algorithms for this, each of which gives you different clues. Broken down, these are trend and outlier analysis
Trend analysis
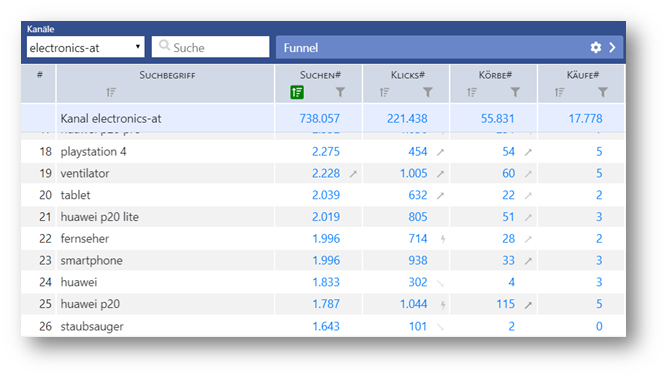
The trend analysis is represented by a small gray arrow next to each KPI. The arrow points either upwards for an upward trend or downwards for a downward trend. The respective intensity of the algorithm is visualized by the intensity of the gray tone. In the following example, we looked at the top search terms in our channel and noticed that there is an upward trend for the search term "tragus":
If we pull up the search term and select the comparison period at the top right, the trend can be clearly seen. The dashed line represents the previous period:
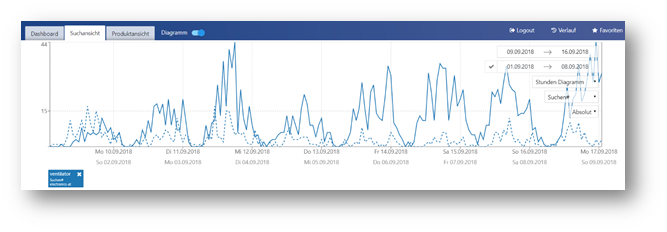
The search volume for the current week is significantly higher!
Outlier analysis
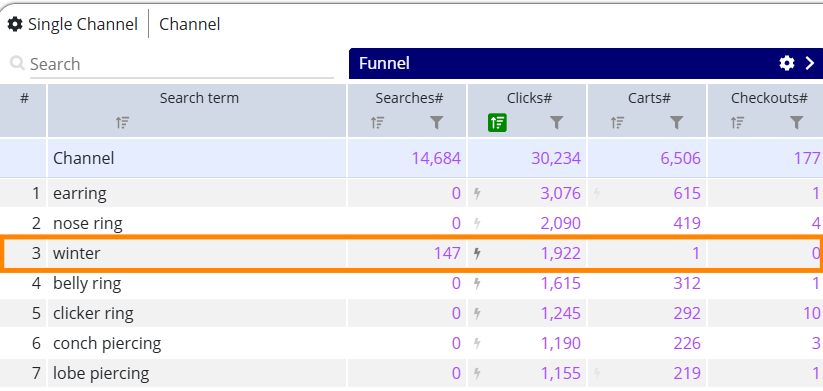
The outlier analysis works in a similar way by always calculating whether a search term has an unusual outlier compared to the lead time:
In a direct comparison of the preliminary period in the graph view, the outliers can be seen at a glance. The dashed line shows the previous week:
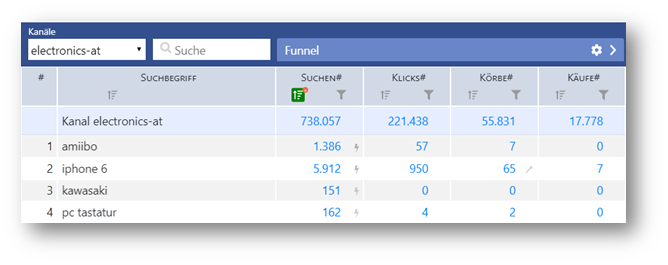
The outlier analysis is particularly helpful in identifying bots that make extremely high numbers of searches at certain times of the day or click through many products but don't buy anything. Here you should look at the sessions in detail again and compare the transmitted session ID with the one in the server logs in order to possibly blacklist the IP.